Charts and graphs are still the foundation of most great looking infographics, and Adobe Illustrator is still the premiere application for creates to design them in.

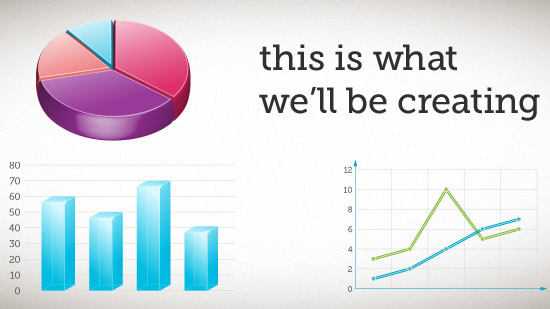
Tutorial9 shows you how to create stunning 3D graphs and charts in Illustrator
Tutorial9 has a fantastic tutorial that shows you how to create stunning 3D graphs and charts in Illustrator. Be sure to check out all the other tutorials and free resources available at Tutorial9.
